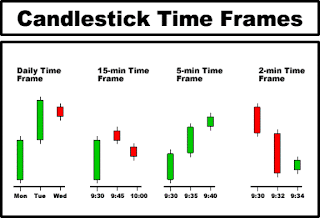
Candlestick Line Time Frames
One of the beautiful attributes of the candlestick line is that the same analysis can be applied to multiple time frames.
The time frame of a candlestick line is the time duration between the candlestick's opening price and closing price.
For example, a daily candlestick chart would consist of candlestick lines with opening prices corresponding with the day's opening price, and closing prices corresponding with the day's closing price (Figure 25).
A 5-minute candlestick chart would have candlestick lines with time duration of 5 minutes between each candlestick's opening price and closing price.
Most good computer charting software allows easy conversion from one time frame to the next.
As we will see in latter examples, utilizing several different time frames in viewing a stocks candlesticks pattern is a very effective way to read the underlying sentiments behind a stocks movement.

0 komentar:
Post a Comment